Orbital Map (2012)
personal significance & density: TINY
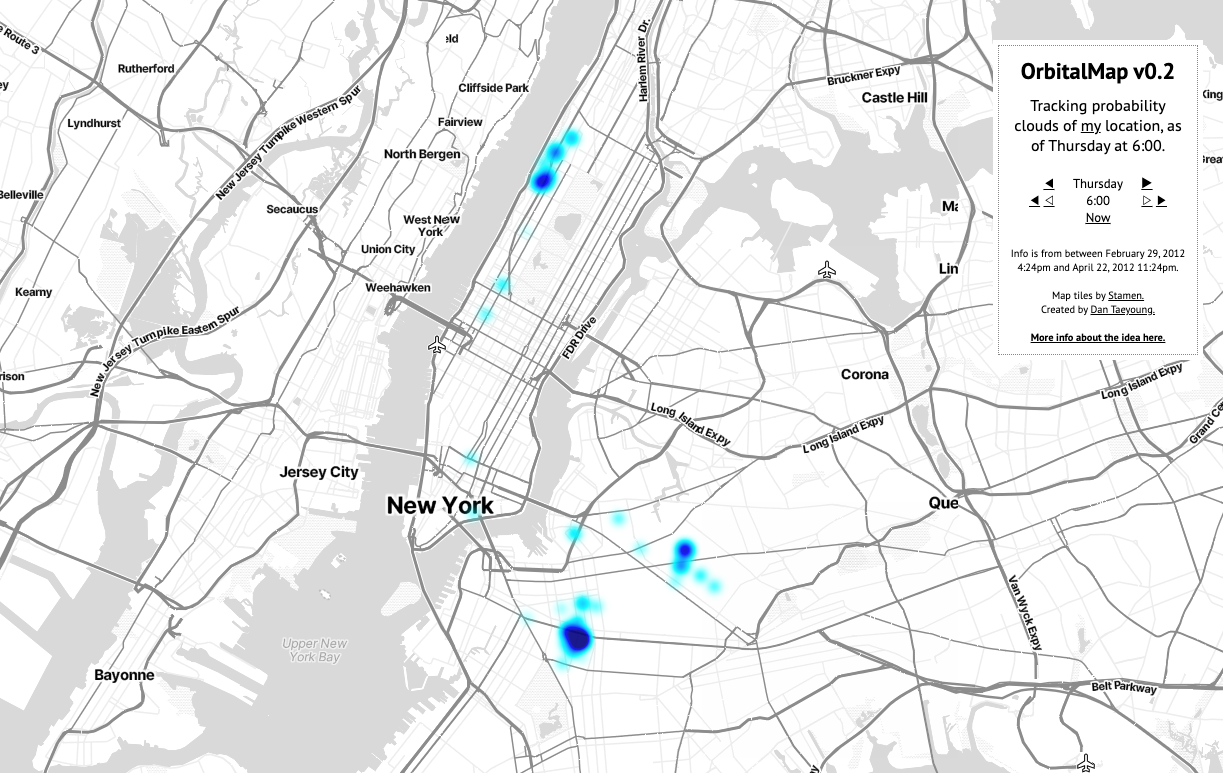
OrbitalMap creates rough frequency maps of my probable location out of live location data. The idea is to create a map-based visualization that is neither an intrusive surveillance nor abstracted statistic, but rather a kind of 'abstracted surveillance' that is non-intrusive yet personal. By distilling location data into probabilities, much like the orbital maps of electron distributions around a proton, spatial information becomes abstracted into patterns of activity and behavior.
The endgoal of the map is to visualize other patterns of behavior; to be able to chart the difference between oft-frequented locations (such as a home, a school, a workplace) and one-off excursions (a warehouse exhibit in Queens, a visit to upstate New York, a bike ride to Fort Tilden, etc.)
Tech details: OrbitalMap utilizes OpenPaths; speed, duration, are derived from data, and erroneous information is detected and discarded. A rudimentary algorithm calculates the rough probability distribution, plots a series of points (offset by random distances, as to not offer exact location data) with an opacity that corresponds to probability. The points are weighted with a gradually diminishing curve for visualization's sake, rather than for accuracy's sake. As of v0.2, this is running on a very rudimentary amalgamation of the Google Maps API, Javascript, Python scripts run by cron, etc.